You place tremendous value on customer interactions if you offer any live chat system. Beyond that, however, you also want to understand the customer experience, as it helps you refine your strategy to deliver value continuously.
However, it would be best to have actionable insights to do this properly. How do you get these? That’s where live chat metrics come into the equation.
The idea is to use them as performance indicators to pivot where necessary and continue to do what you do well.
Importance of Tracking Your Live Chat Metrics
In any business, there is a series of numbers that help you to understand where you stand. This doesn’t necessarily speak to an accounting perspective, as other underlying figures relate to other areas, such as customer retention, which may translate to the kind of revenue that the business can pull in.
Many of these metrics lie under the customer engagement umbrella, and ascertaining how to measure that side of things is key to top-tier customer service.
Your underlying product or service is only one part of the equation. Another critical piece of the puzzle is what interactions are like with the customer.
Think of it this way, a restaurant, for example, could have the best menu prepared by the best chef in the world. However, if the wait staff is rude and inattentive, even the hungriest of potential customers may go elsewhere as they prefer to feel valued.
Here’s a look at some metrics you should pay attention to if you have a live chat on your website.
Key Metrics to Track
Volume of Chats
As the name implies, this speaks to the number of chats that filter in. It’s a metric usually measured over a set time frame. For example, you may look at it for the day, week, month, or above.

Note that it concerns more than just the number of handled chats. If there were missed chats for any reason, including customers not being able to deal with the wait time, these would still be factored in.
Note, however, that there are better metrics in isolation to track live chat success or failure. You must consider it alongside other data points to get a complete picture.
Chats Per Day
This was briefly alluded to in the point above. You may have a system that provides your totals as an aggregate, but you want to look at things more granularly.
Here, you can use the chats per day metric to give you an idea of the number of conversations your team handled daily during the work week.
You may want to see what performance looks like each day, or you may want to get an idea of your peak chat activity and on which days to expect it.
Successful Chat Conversations
This is another element of your total volume, which lies on the fence’s positive side. While different companies may have different definitions of what constitutes a successful chat, it is usually those handled by one of your representatives.

Typically, a functionality is embedded in your chat app of choice that allows the customer, the representative, or both to indicate that the conversation is completed.
Again, depending on how your business evaluates the matter, a successful chat conversation may also consider the customer’s rating on the interaction.
Missed Chats
It’s no secret that a customer service team cannot get to every single customer who reaches out. Acting on the engagement side of things would have to be so low compared to the number of representatives that nothing is missed.
Of course, this is not optimal, as it means that customers would not engage with your product or service as much as is desirable.
As the name implies, a missed chat is one that the team still needs to get to. You need to understand that there may be different reasons for this, and your strategy to keep this low number needs to factor these in.
For example, you may realize that many missed chats occur because a customer navigates away from the page before a representative can accept the chat request.
In this case, it would probably be a good idea to look at the wait time to set a precedent. For example, you may have an SLA of about a minute.
As you strategize to improve, you likely wouldn’t necessarily consider chats canceled less than a minute after the initial request.
Nevertheless, the aim is always to keep missed chats at zero or as close to zero as possible. Remember that if you don’t get the opportunity to engage with your customer base, it’s not unlikely that a competitor will.
There are other solutions to this than throwing more customer service reps at the problem. For example, you may be able to capitalize on a chat app that offers redirection or accepts contact details for a callback so a follow-up can be done.
Waiting Time
This one is also self-explanatory. It considers the time a visitor to your page would be waiting before a customer service representative engages with the person.
In most cases, this one is taken as an average. Missed chats would not be a part of the calculation here, considering that there would be no acceptance of the conversation by a customer service representative.
There are two advantages to evaluating this KPI for customer service. First, it provides an understanding of the team’s capabilities to handle the traffic.
Next, many businesses use this metric to give customers an idea of how long they will likely have to wait before our representative gets to them.
Response Time
This is sometimes confused with the waiting time metric. The best way to look at it is waiting time is based on the initial response time. In other words, after a customer has initiated a request via live chat, how long does it take a representative to accept and send that first message?

Response time, on the other hand, is rooted in the conversation that follows. If the customer sends a message, you would evaluate how long your team member takes to respond to the message.
You have to be careful about how you use this metric, though. Sometimes, customer service management places a heavy emphasis on the figures, leading the team to focus more on them than the actual quality of the service.
Duration of Chat
This is another common one used to track live chat performance individually. It measures the length of the conversation from beginning to end.
Ideally, the idea is to resolve the customer’s query as efficiently as possible, which usually translates to low chat duration.
However, like the previous point, you want to be careful in addressing high durations and how much representatives may have to deal with consequences.
Conversely, if you find your average figure too high, you must pay serious attention to the elements of a conversation causing this issue.
Messages Per Chat
Using this metric in isolation is tough to evaluate the quality of service and the team’s capabilities.
As the name implies, this is a measurement of the number of messages that may be sent during a chat.
One of the problems here is that two customers inquiring about the same thing can generate two wildly different message counts for legitimate reasons.
For example, imagine that your customer service team only provides English support. There may be a customer whose first language is not English, leading to more clarification than usual on both ends. On the other hand, you have a customer who speaks perfect English.
You may find that a chat with the letter ends with a significantly lower message count. Therefore, you want to think about how you evaluate these numbers.
Tags Per Category
Tags are handy as they are a great way to evaluate where your efforts should be directed. Depending on your product or service, a customer can likely reach out for several reasons.
For example, there may be calls for product support, account setup, billing, etc. Based on the nature of the chats handled by your customer service team, you can begin to allocate percentages to the number of chats that come in under each tag.
The insights you get from this can help you do two things. First, there is the team restructuring benefit. You may need less focus on one area and more focus on another. Therefore, you may shuffle team members around to meet the demand.
Alternatively, you can make decisions elsewhere that could change the need for specific customer requests.
Imagine that you’ve made a big change to your platform, and customers are largely unaware. This likely leads to a host of live chat requests, which see customers reaching out and asking what to do now that the change has been implemented.
In realizing this, you could equip your site with a pop-up bulletin advising customers what to do if this is their reason for visiting the site. That additional element would reduce the number of customer service requests for that issue.
Channels Used
To ensure you can reach your customers effectively, you likely have multiple channels they can use to reach out to your team. There may be a live chat, e-mail, phone, etc.
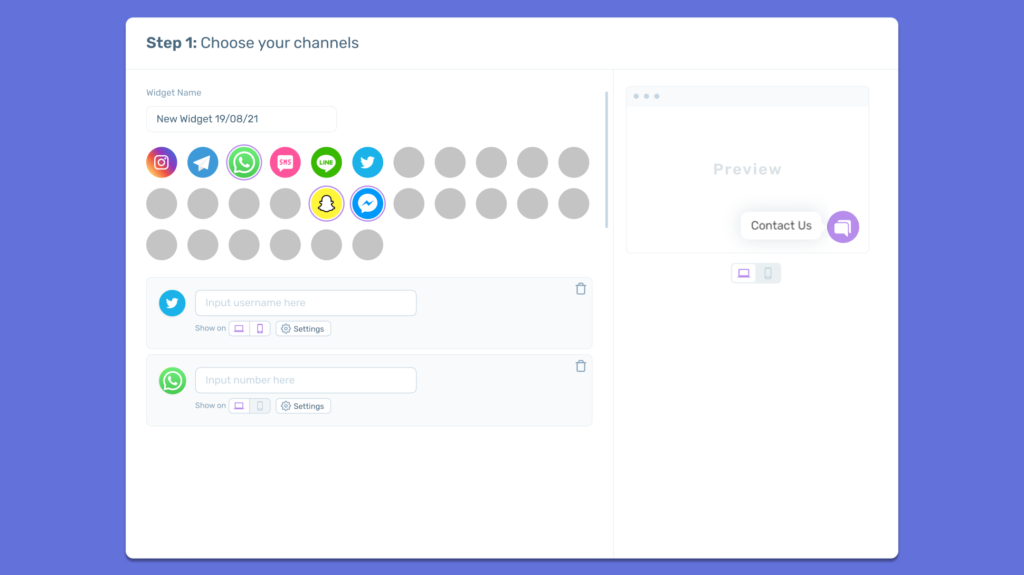
For example, if you use a live chat system such as Chaty, the chat app element may further be broken down. why is this? Well, while Chaty would give you a single dashboard, on the customers’ end, they can use their favorite social media platforms. So, in this sense, you could evaluate where the bulk of your traffic is coming from.
Conversion Rate (Sales, Subscribers, Leads, Etc.)
A big part of interactions is to secure initial or repeat conversion. In looking at things from a customer journey-based view, you can evaluate the number of interactions generating the kind of results you want.
For example, how many potential customers that have a conversation about a product or service go through with the purchase? What do the lead numbers look like? What about lead qualification?
To what extent is your live chat metric allowing you to gain and maintain subscribers? All this information can help you to refine your strategy.
Use of Canned Responses
Canned responses are often used to help reduce the burden on the human element of the customer service offering where possible. These are predefined responses typically set up based on a realization that specific questions or issues occur frequently.
An evaluation of usage may be able to help you understand their effectiveness. Additionally, as you evaluate conversations, you may see the need to implement new canned responses.
Satisfaction Score
This is typically a score associated with a customer satisfaction survey that is provided at the end of engagements. To avoid burdening the customer, a one-to-five-star rating or a few adjectives can be selected to indicate what the interaction felt like.

Optionally, the customer is usually allowed to leave a written comment. This is a crucial CSAT metric as you have customers tell you what they liked and what you can work on.
The Bottom Line
There are lots of metrics that can help you to provide adequate customer service. You are highly encouraged to track them, evaluate them, and use them to refine your engagement style consistently.
Many engagement tools are available, but it takes a bit of research to find the one that aligns with you best. Some chat apps even have built-in analytics, which eliminates the need for third-party tools.
Getting Started with Chaty
Chaty provides a single dashboard at the back end of a multi-channel setup, allowing your clients to interact with you from wherever they are compatible. It has a series of widgets that help you to win over your clients. Additionally, there is built-in Google Analytics, page targeting, traffic source targeting, etc.
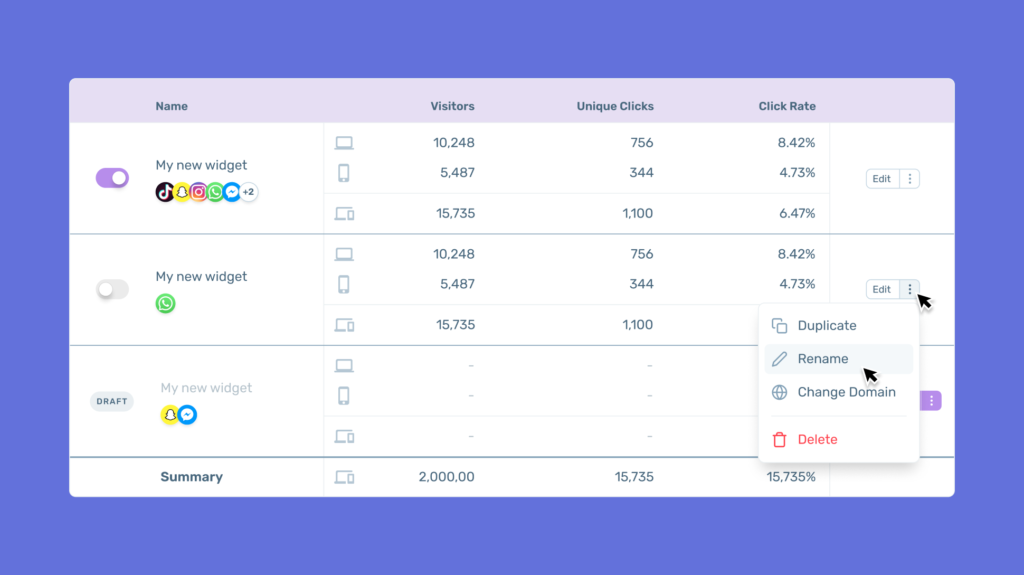
Being able to accommodate multiple channels, including custom ones, is one thing. However, the level of customization, extensive documentation, and analytical capabilities help you use a single system to engage with your customers and evaluate your effectiveness.
Try and get started now!

